| Structure | Name/CAS No. | Articles |
|---|---|---|
 |
3-hydroxybutyric acid
CAS:300-85-6 |
|
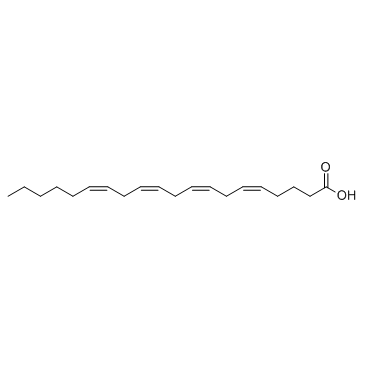 |
Arachidonic acid
CAS:506-32-1 |
|
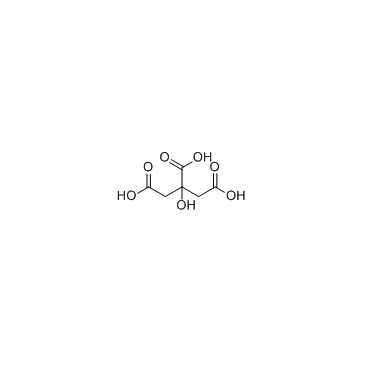 |
Citric Acid
CAS:77-92-9 |
|
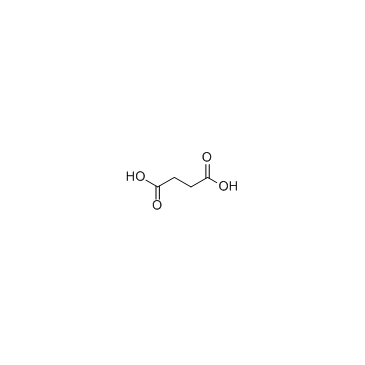 |
Succinic acid
CAS:110-15-6 |
|
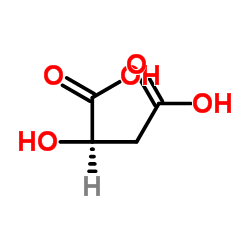 |
D-(+)-Malic acid
CAS:636-61-3 |
|
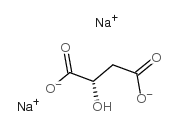 |
L-()-Malic acid disodium salt
CAS:138-09-0 |
|
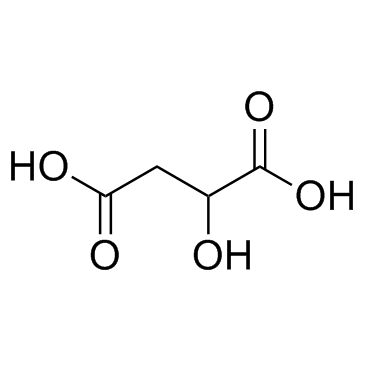 |
(±)-Malic Acid
CAS:6915-15-7 |
|
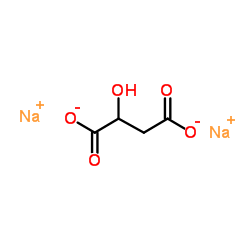 |
Sodium DL-Malate
CAS:676-46-0 |
|
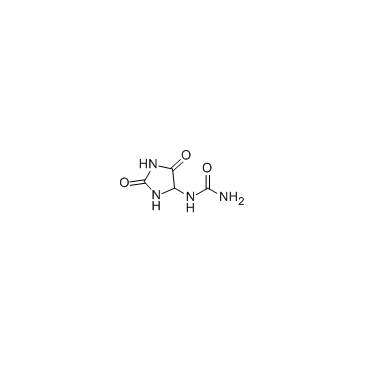 |
allantoin
CAS:97-59-6 |
|
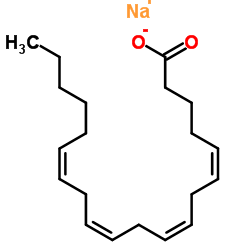 |
Sodium (5Z,8Z,11Z,14Z)-5,8,11,14-icosatetraenoate
CAS:6610-25-9 |