| Structure | Name/CAS No. | Articles |
|---|---|---|
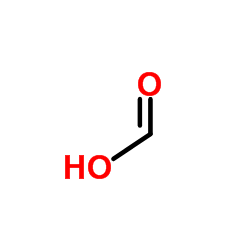 |
Formic Acid
CAS:64-18-6 |
|
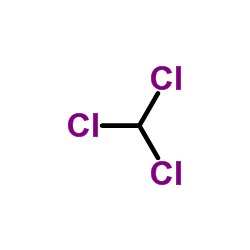 |
Chloroform
CAS:67-66-3 |
|
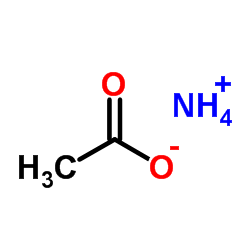 |
Ammonium acetate
CAS:631-61-8 |
|
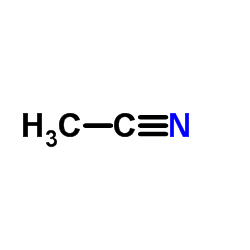 |
Acetonitrile
CAS:75-05-8 |
|
 |
Methanol
CAS:67-56-1 |
|
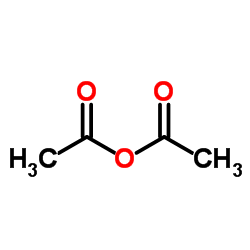 |
Ethanoic anhydride
CAS:108-24-7 |
|
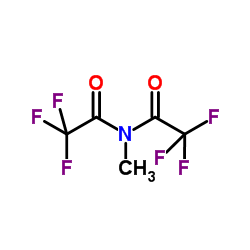 |
N-Methyl-bis(trifluoroacetamide)
CAS:685-27-8 |
|
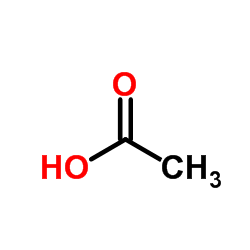 |
acetic acid
CAS:64-19-7 |
|
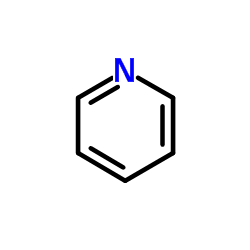 |
Pyridine
CAS:110-86-1 |
|
 |
Chlorotrimethylsilane
CAS:75-77-4 |