867160-71-2

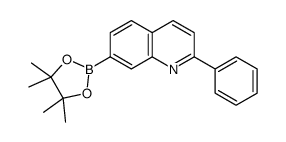
867160-71-2 structure
- Name: OSI-906(Linsitinib)
- Chemical Name: 3-[8-amino-1-(2-phenylquinolin-7-yl)imidazo[1,5-a]pyrazin-3-yl]-1-methylcyclobutan-1-ol
- CAS Number: 867160-71-2
- Molecular Formula: C26H23N5O
- Molecular Weight: 421.494
- Catalog: Biochemical Inhibitor Protein tyrosine kinase
- Create Date: 2018-12-27 08:32:05
- Modify Date: 2026-06-30 07:00:07
-
Losmapimod is a dual inhibitor of the IGF-1 receptor and insulin receptor with IC50s of 35 and 75 nM, respectively.
| Name | 3-[8-amino-1-(2-phenylquinolin-7-yl)imidazo[1,5-a]pyrazin-3-yl]-1-methylcyclobutan-1-ol |
|---|---|
| Synonyms |
cis-3-[8-amino-1-(2-phenyl-quinolin-7-yl)-imidazo[1,5-a]pyrazin-3-yl]-1-methylcyclobutanol
OSI-906 (Linsitinib) Kinome_3532 cis-3-(8-amino-1-(2-phenyl-7-quinolinyl)imidazo(1,5-a)pyrazin-3-yl)-1-methylcyclobutanol Linsitinib cis-3-[8-amino-1-(2-phenylquinolin-7-yl)imidazo[1,5-a]pyrazin-1-yl]-1-methylcyclobutan-1-ol OSI906 cis-3-[8-Amino-1-(2-phenyl-7-quinolinyl)imidazo[1,5-a]pyrazin-3-yl]-1-methylcyclobutanol OSI-906AA OSI-906 |
| Description | Losmapimod is a dual inhibitor of the IGF-1 receptor and insulin receptor with IC50s of 35 and 75 nM, respectively. |
|---|---|
| Related Catalog | |
| Target |
IC50: 35 nM (IGF-1R), 75 nM (InsR) |
| In Vitro | Linsitinib inhibits IGF-1R autophosphorylation and activation of the downstream signaling proteins Akt, ERK1/2 and S6 kinase with IC50 of 0.028 to 0.13 μM. Linsitinib enables an intermediate conformation of the target protein through interactions with the C-helix. Linsitinib displays favorable metabolic stability in liver microsomes. Linsitinib fully inhibits both IR and IGF-1R phosphorylation at a concentration of 1 μM. Linsitinib inhibits proliferation of several tumor cell lines including non-small-cell lung cancer and colorectal cancer (CRC) tumor cell line with EC50 of 0.021 to 0.810 μM[1]. |
| In Vivo | Linsitinib inhibits tumor growth in an IGF-1R-driven xenograft mouse model, with 100% TGI and 55% regression at a dose of 75 mg/kg and 60% TGI and no regression at a dose of 25 mg/kg. Linsitinib administration induces different elimination half-lives of itself in dog, rat and mice, the elimination half-lives are 1.18 hours, 2.64 hours and 2.14 hours, respectively. Linsitinib administration at different single dose once-daily in femal Sprague-Dawley rat and femal CD-1 mouse reveal that the Vmax is not dose-proportional to Linsitinib dose. Linsitinib elevates the blood glucose levels at a dose of 25 mg/kg after 12 days administration. Linsitinib administration at a single dose of 75 mg/kg in IGF-1R-driven full-length human IGF-1R (LISN) xenograft mouse model achieve maximal inhibition of IGF-1R phosphorylation (80%) between 4 and 24 hours with plasma drug concentrations of 26.6-4.77 μM[1]. Linsitinib administered as a single dose of at 60 mg/kg in NCI-H292 xenografts mice inhibits uptake of glucose at 2, 4, and 24 hours post-treatment in vivo. Linsitinib inhibits the growth of tumors in NCI-H292 xenograft mouse model[2]. |
| Kinase Assay | Protein kinase assays are either performed in-house by ELISA-based assay methods (IGF-1R, IR, EGFR and KDR) or by a radiometric method with ATP at 100 µM concentration. In-house ELISA assays use poly(Glu:Tyr) as the substrate bound to the surface of 96-well assay plates and phosphorylation is detected using an antiphosphotyrosine antibody conjugated to horseradish peroxidase. The bound antibody is quantified using ABTS as the peroxidase substrate by measuring absorbance at 405/490 nm. All assays use purified recombinant kinase catalytic domains. Recombinant enzymes of human IGF-1R or EGFR are expressed as an NH2-terminal glutathione S-transferase fusion protein in insect cells and are purified in house. IC50 values are determined from the sigmoidal dose-response plot of percent inhibition versus log10 compound concentration. A minimum of three measurements, performed in duplicate, are carried out with in-house assays unless otherwise indicated. Linsitinib at a concentration of 1 µM is profiled versus a panel of kinases using the ProfilerProTM Kinase Selectivity Assay Kit. |
| Cell Assay | For assays of cell proliferation, cells are seeded into 96-well plates in appropriate media containing FCS 10% and incubated for 3 days in the presence of Linsitinib at various concentrations. Inhibition of cell growth is determined by luminescent quantitation of intracellular ATP content using CellTiterGlo. Data is presented as a fraction of maximal proliferation, calculated by dividing the cellular density in the presence of varying concentrations of Linsitinib by the cellular density of control cells treated with vehicle (DMSO) only. |
| Animal Admin | Cells are harvested from cell culture flasks during exponential cell growth, washed twice with sterile PBS to a suitable concentration before subcutaneous implantation on the right flank of female nu/nu CD-1 mice. Tumors are established to 200±50 mm3 in size before randomization into treatment groups of eight mice each for efficacy studies. Linsitinib or vehicle is administered orally as indicated. The %TGI values indicated are the median %TGI over the entire dosing period. TGI of at lease 505 is considered significant. Growth delay is calculated as T-C shere T and C are the times in days for mean tumor size in the treated (T) and control (C) groups to reach 400% of the initial tumor volume. Cures are excluded from this calculation. |
| References |
| Density | 1.4±0.1 g/cm3 |
|---|---|
| Molecular Formula | C26H23N5O |
| Molecular Weight | 421.494 |
| Exact Mass | 421.190247 |
| PSA | 89.33000 |
| LogP | 3.23 |
| Index of Refraction | 1.748 |
| Storage condition | -20℃ |
|
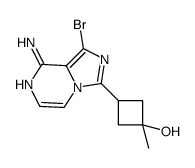
~66%
867160-71-2 |
| Literature: OSI PHARMACEUTICALS, LLC; CASTELHANO, Arlindo, L.; CUTTING, Gary, A.; LOCKE, Andrew, J.; MAO, Yunyu; MULVIHILL, Kristen, Michelle; NORRIE, Robert; O'BRIEN, Andrew, J.; PARK, Stuart, R.; RECHKA, Josef, A.; STEVENS, Andrew, Michael; THOMAS, Christopher, I. Patent: WO2012/16095 A1, 2012 ; Location in patent: Page/Page column 12-13 ; |
|
~%
867160-71-2 |
| Literature: WO2012/16095 A1, ; |

| Precursor 3 | |
|---|---|
| DownStream 0 | |