Critical comparison of selected olfactometric methods for the determination of impact odorants. Proposal of a new representation of olfactometric results
Esméralda Cicchetti, Clémence Vasseur
文献索引:10.1002/ffj.3426
全文:HTML全文
摘要
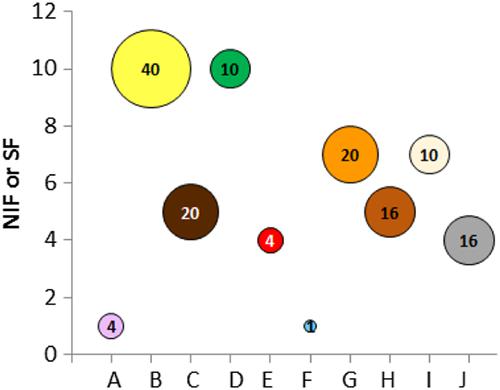
Representation of olfactory data is a key parameter in GC-O to simplify interpretation. Actual presentation of hybrid results, taking into account both detection frequency and odor intensity, can be improved to be more informative. We propose in this study a new way of representing olfactograms taking into account the three dimensions: detection frequency, odor intensity and odor description using bubble charts. Odor description is represented by colors that were associated to the 25 olfactory families defined in this work using binomial probability statistics without any smelling step. Buble charts are proposed in this paper to represent olfactometric data taking into account detection frequency, odor intensity and odor description. Odor description is represented by colors that were associated to the 24 olfactive families defined in this work using binomial probability statistics without any smelling step.