544417-40-5
544417-40-5 structure
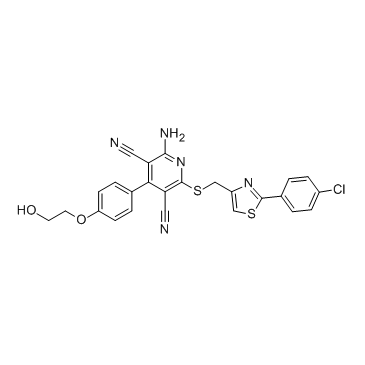
- Name: Capadenoson
- Chemical Name: 2-amino-6-[[2-(4-chlorophenyl)-1,3-thiazol-4-yl]methylsulfanyl]-4-[4-(2-hydroxyethoxy)phenyl]pyridine-3,5-dicarbonitrile
- CAS Number: 544417-40-5
- Molecular Formula: C25H18ClN5O2S2
- Molecular Weight: 520.026
- Catalog: Signaling Pathways GPCR/G Protein Adenosine Receptor
- Create Date: 2018-08-04 11:19:46
- Modify Date: 2025-08-25 10:16:56
-
Capadenoson is a selective agonist of adenosine-A1 receptor.
| Name | 2-amino-6-[[2-(4-chlorophenyl)-1,3-thiazol-4-yl]methylsulfanyl]-4-[4-(2-hydroxyethoxy)phenyl]pyridine-3,5-dicarbonitrile |
|---|---|
| Synonyms |
CS-1228
Capadenoson 2-Amino-6-({[2-(4-chlorophenyl)-1,3-thiazol-4-yl]methyl}sulfanyl)-4-[4-(2-hydroxyethoxy)phenyl]-3,5-pyridinedicarbonitrile UNII-O519NVW73R |
| Description | Capadenoson is a selective agonist of adenosine-A1 receptor. |
|---|---|
| Related Catalog | |
| Target |
Adenosine A1 receptor[1] |
| In Vitro | To further elucidate the pharmacological properties of Capadenson, GTP shift assays are performed with the standard full A1-agonist CCPA and the A1-antagonist 8-cyclopentyl-1,3-dipropylxanthine (DPCPX). CCPA shows a Ki value of 4.2 nM in the binding assay on rat cortical brain membranes. In the presence of 1 mM GTP this Ki value shifts to a value of 64 nM. Therefore the GTP shift for CCPA is 15. DPCPX shows a GTP shift of 1 with virtually identical Ki values in the absence and presence of GTP. Capadenson shows a Ki value of 24 nM in the binding assay. In the presence of 1 mM GTP this Ki value shifts to a value of 116 nM resulting in a GTP shift of 5 for Capadenoson[1]. |
| In Vivo | In the in vivo experiments, Wistar rats and SHR are pre-treated with Capadenoson at a concentration of 0.15 mg/kg for 5 days. On day 5, a stress test (physical restraint) is performed for 2 hours. The plasma concentration of Capadenoson measured 3 hours after drug intake remains constant in the 5 days prior to the restraint stress test and averaged 7.63 µg/L on day 4 and 5, respectively[1]. |
| Kinase Assay | Membranes from the human cortex are prepared. [35S]GTPγS binding is measured. Briefly, 5 µg of membrane protein is incubated in a total volume of 160 µL for 2 hr at 25°C in a shaking water bath. [35S]GTPγS binding in control incubations and in the presence of capadenoson showed a linear time course up to this incubation time. Binding buffer contained 50 mM Tris/HCl, pH 7.4, 2 mM triethanolamine, 1 mM EDTA, 5 mM MgCl2, 10 µM GDP, 1 mM dithiothreitol, 100 mM NaCl, 0.2 units/mL adenosine deaminase, 0.2 nM [35S]GTPγS, and 0.5% bovine serum albumin. Non-specific binding is determined in the presence of 10 µM GTPγS. Incubations are terminated through filtration of the samples over multiscreen FB glass fiber filters followed by two washes with binding buffer. The filters are dried, coated with scintillator and counted for radioactivity. Binding curves of [35S]GTPγS are analyzed by nonlinear regression using GraphPad Prism[1]. |
| Animal Admin | Rats[1] A total of 14 Wistar rats and 18 SHR (body weight 200-50 g, all female) underwent experiments to evaluate the exocytotic, stimulation-induced NE release during electrical field stimulation. Rats are killed by an injection of pentobarbital i.p. (0.5 mL/100 mg body weight), and hearts are rapidly excised, and placed in ice cold Krebs-Henseleit solution (KHL). They are quickly mounted on a Langendorff apparatus for retrograde perfusion with KHL. Perfusion rate is kept constant at 10 mL/min, the temperature is adjusted to 37°C, and the pH to 7.4 through bubbling with 5% CO2/95% O2. Via an inflow line desipramine at a concentration of 10−7 M is added to the perfusion buffer. After an equilibration period of 20 minutes, electrical field stimulation is commenced via two metal paddles adjacent to both sides of the beating heart for 1 minute (5V, 6 Hz). We collected the efflux in plastic tubes the minute before, during, and 3 minutes after the stimulation. These are rapidly frozen in liquid nitrogen and stored at −20°C till analysis. The NE release is calculated as the cumulative release induced by the electrical stimulation. After the first stimulation (S1), the study drug Capadenoson at concentrations of 30 µg/L (6×10⁻⁸ M) or 300 µg/L(6×10−7 M), or 2-chloro-N6-cyclopentyladenosine (CCPA, 10−6 M), respectively, are added via separate perfusion lines for 30 minutes. After this time a second stimulation (S2) is executed to determine the effect of the drugs on NE release compared to the first stimulation. The effect of each pharmacological intervention is analysed by calculating the ratio of NE release induced by the second and first stimulation (S2/S1 ratio). |
| References |
| Density | 1.5±0.1 g/cm3 |
|---|---|
| Boiling Point | 787.9±70.0 °C at 760 mmHg |
| Molecular Formula | C25H18ClN5O2S2 |
| Molecular Weight | 520.026 |
| Flash Point | 430.3±35.7 °C |
| Exact Mass | 519.059021 |
| PSA | 182.38000 |
| LogP | 6.15 |
| Vapour Pressure | 0.0±2.9 mmHg at 25°C |
| Index of Refraction | 1.735 |
| Storage condition | 2-8℃ |