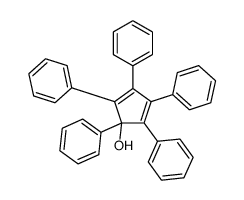
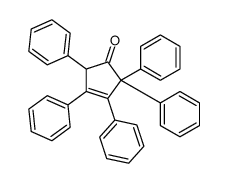
Results Plotting the logarithm of the percent concentration of the starting alcohols (1 or 2) at the temperatures (150,165, 180,190,200, and/or 210 “C) investigated vs. time afforded a series of curves for each substitutent. All the plots showed an increase in the slope of the line as the temperature was increased, which is in accord with increases in the rate of the reactions with increasing temperature. Since a straight line was obtained in all the above ...